
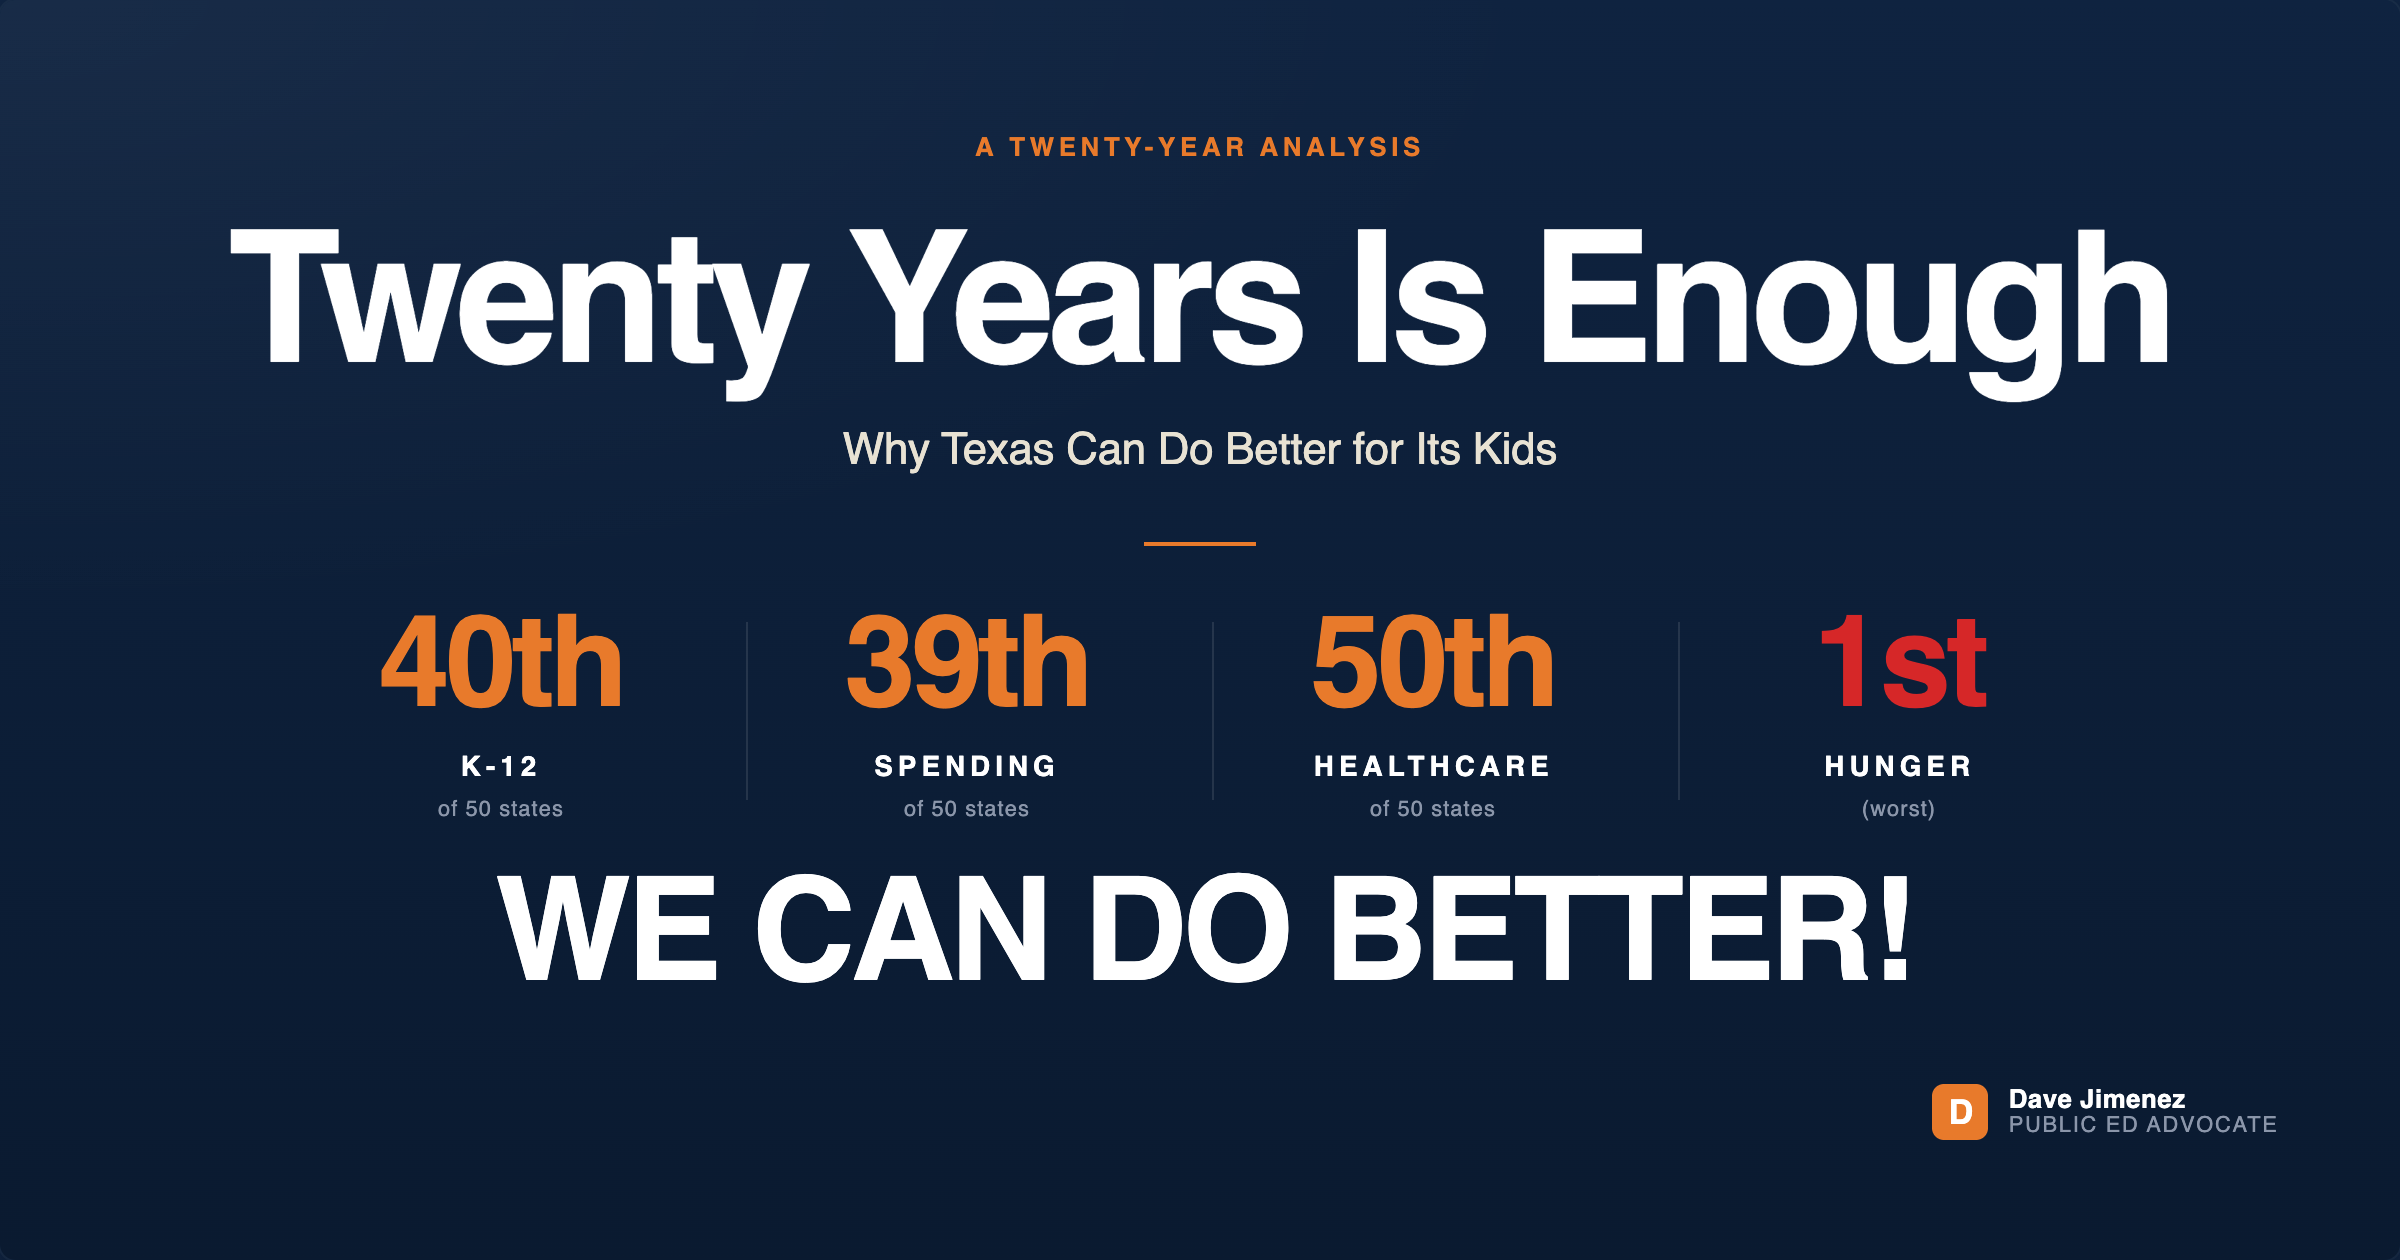
Twenty Years Is Enough: Why Texas Can Do Better for Its Kids
For 20 years, Texas has ranked at or near the bottom of the nation in K-12 education, per-pupil funding, children's healthcare, and childhood hunger. The trajectory hasn't improved across multiple gubernatorial administrations or through booms and busts in state revenue. Better is possible. Texas just keeps choosing otherwise.
A twenty-year look at the Texas state rankings that matter most to children and public schools
Key Findings
- Texas ranks tied for 40th in the nation for school systems overall in 2026 (WalletHub).
- Texas ranks 39th in K-12 per-pupil spending, approximately $4,000 below the national average (Texas State Teachers Association, 2025).
- Texas has ranked dead last in the nation for children's health insurance coverage for 19 consecutive years from 2006 through 2024 (UnidosUS).
- Texas leads the nation in food-insecure people, including 1.67 million food-insecure children, or one in five Texas children (Feeding Texas, 2025).
- These rankings have remained at or near the bottom across multiple gubernatorial administrations and through booms and busts in state revenue. Better outcomes are possible. Texas has chosen otherwise.
I've been deep in the data of how our state funds and supports public education for a couple of years now. I've written about what private school vouchers will cost CFBISD. I've written about how our enrollment timing puts us at a structural disadvantage compared to neighboring districts. Both of those analyses focused on the local impact of state-level decisions.
This piece zooms out. It looks at where Texas stands today across four areas that directly affect children and public schools, and where Texas stood in 2016 and 2006. The picture that emerges is not flattering. It is also not new.
Texas has been at or near the bottom of the nation in the rankings that matter most to kids for two decades. Across multiple gubernatorial administrations. Across booms and busts in state revenue. Across population growth that has made us the second-most populous state in America. The trajectory has not improved. In some categories, it has gotten worse.
This is not an accident. It is a choice. And it is a choice the people who hold power in Austin keep making.
The good news is that choices can be reconsidered. Texas has the resources, the talent, and the political infrastructure to do better. What we have lacked is the will. This article makes the case that the will should change, and shows what twenty years of data tells us about why.
How Does Texas Compare on K-12 Education?
2025-2026: Texas ranks tied for 40th in the nation for school systems overall, according to WalletHub's 2026 analysis. On the National Assessment of Educational Progress, the most recent data shows Texas ranking 38th in fourth-grade reading, 44th in eighth-grade reading, and 34th in eighth-grade math.
2016: Texas ranked in the bottom third on most national K-12 measures, with NAEP scores in the 30s and 40s for reading and math.
2006: Texas ranked 39th in per-pupil spending and was generally classified in the bottom-third tier for academic outcomes by national measures.
The pattern: Texas has remained in the bottom third for K-12 education for two decades. The state has not meaningfully improved its national position despite significant population growth and substantial increases in nominal education spending.
What Is Texas Spending Per Student Compared to Other States?
2025-2026: Texas ranks 39th nationally in K-12 education funding per pupil, according to EducationData.org's most recent analysis. Texas spends approximately $13,189 per student in average daily attendance, roughly $4,000 below the national average. Even after the Texas Legislature's 2025 increase, Texas remains projected to rank approximately 39th once other states' increases are factored in.
2016: Texas ranked 36th in per-pupil expenditures, $2,316 below the national average of $11,787, according to the National Education Association's 2016 rankings.
2006-2007: Texas ranked 39th in per-pupil spending, according to NEA data.
The pattern: Texas per-pupil spending has been chronically below the national average for the entire 20-year period. The state's relative ranking has fluctuated between 35th and 44th, but Texas has never broken into the top half. Adjusted for inflation, per-pupil spending in Texas was effectively flat from 2005 to 2019, with a modest increase in 2019 and another in 2025.
How Does Texas Rank for Children's Healthcare?
2025-2026: Texas ranks dead last in the nation for children's health insurance coverage. According to 2024 Census American Community Survey data, 13.6 percent of Texas children lack health insurance, more than double the national rate of 6.0 percent. The Commonwealth Fund's 2025 Scorecard on State Health System Performance ranks Texas 50th overall for healthcare system performance. WalletHub's 2024 analysis ranked Texas 51st (last, including Washington, D.C.) for the percentage of uninsured children and 51st for the percentage of children with unaffordable medical bills.
2016: Texas ranked at or near the bottom for children's uninsured rate, with conditions worse than they are today. UnidosUS analysis of 2006-2024 Census data confirms Texas held the worst position throughout this period.
2006: Texas ranked at the bottom of the nation for children's uninsured rate, the starting year of an unbroken streak.
The pattern: According to UnidosUS, Texas has ranked as America's worst state for children's health insurance coverage for 19 consecutive years, from 2006 through 2024. This is one of the most damning long-term rankings any state holds in any category. It is not a result of recent policy. It is the result of sustained policy choices, including the state's continued refusal to expand Medicaid, a decision that would cover an estimated 1.4 million low-income Texans.
Where Does Texas Rank on Childhood Hunger?
2025-2026: Texas leads the nation in total food insecurity, with 5.4 million people food insecure, or one in six households. Among Texas children, 22.2 percent face hunger, totaling approximately 1.67 million children, or one in five. The Dallas-Fort Worth metro area ranks third nationally for total food insecurity, behind only Los Angeles and New York.
2016: Texas had one of the highest rates of children's food insecurity in the nation, with approximately 22 percent of Texas children, about 1.6 million, experiencing food insecurity.
2006: Texas ranked among the top five states for child food insecurity, with rates around 22 percent of Texas children.
The pattern: Texas has had one of the highest rates of children's food insecurity in the nation for the entire 20-year period. The number of food-insecure Texans has grown alongside population growth, and Texas surpassed California for the second consecutive year as the state with the most food-insecure people in 2025.
Why Has Texas Remained at the Bottom for Two Decades?
When you put all four rankings side by side, the story is striking:
K-12 education: Bottom third for two decades.
Public school funding: Below the national average for two decades.
Children's healthcare: Dead last for nineteen consecutive years.
Children's hunger: Among the worst in the nation for two decades.
Different rankings, different methodologies, different sources. The same conclusion. Texas has not improved its position on any of the metrics that matter most to children's lives during a period of enormous economic and demographic growth in this state.
This is not the story of a state that briefly slipped. It is the story of a state that has held these positions through three different governors, four different lieutenant governors, and a generation of legislative sessions. It has been true under both economic booms and budget shortfalls. It has been true while the state population has grown by roughly seven million people. It has been true while the state's economy became the eighth-largest in the world.
The constant has not been Texas's circumstances. The constant has been the political choices Texas leaders have made about what to fund, what to ignore, and which children deserve to thrive.
The Tenure That Defines the Most Recent Decade
Greg Abbott was sworn in as Governor of Texas on January 20, 2015. Dan Patrick was sworn in as Lieutenant Governor on the same day, January 20, 2015. They have controlled the executive branch and the Texas Senate calendar together for more than eleven years.
During that tenure:
Texas has remained in the bottom third for K-12 education.
Texas has remained below the national average for per-pupil spending, with the basic allotment frozen at $6,160 from 2019 through 2024 before a $55 increase to $6,215 in 2025.
Texas has remained dead last for children's health insurance coverage every single year of their tenure.
Texas has remained at or near the top of the nation for childhood food insecurity, with the absolute number of food-insecure Texans growing.
These leaders have had eleven years and supermajority political control in the Texas Senate to address any of these rankings. They have had access to a Rainy Day Fund that has grown to record levels. They have had legislative sessions in which education funding was a stated priority. They have had the political authority to expand Medicaid, raise the basic allotment to keep pace with inflation, and prioritize the programs that move children out of food insecurity.
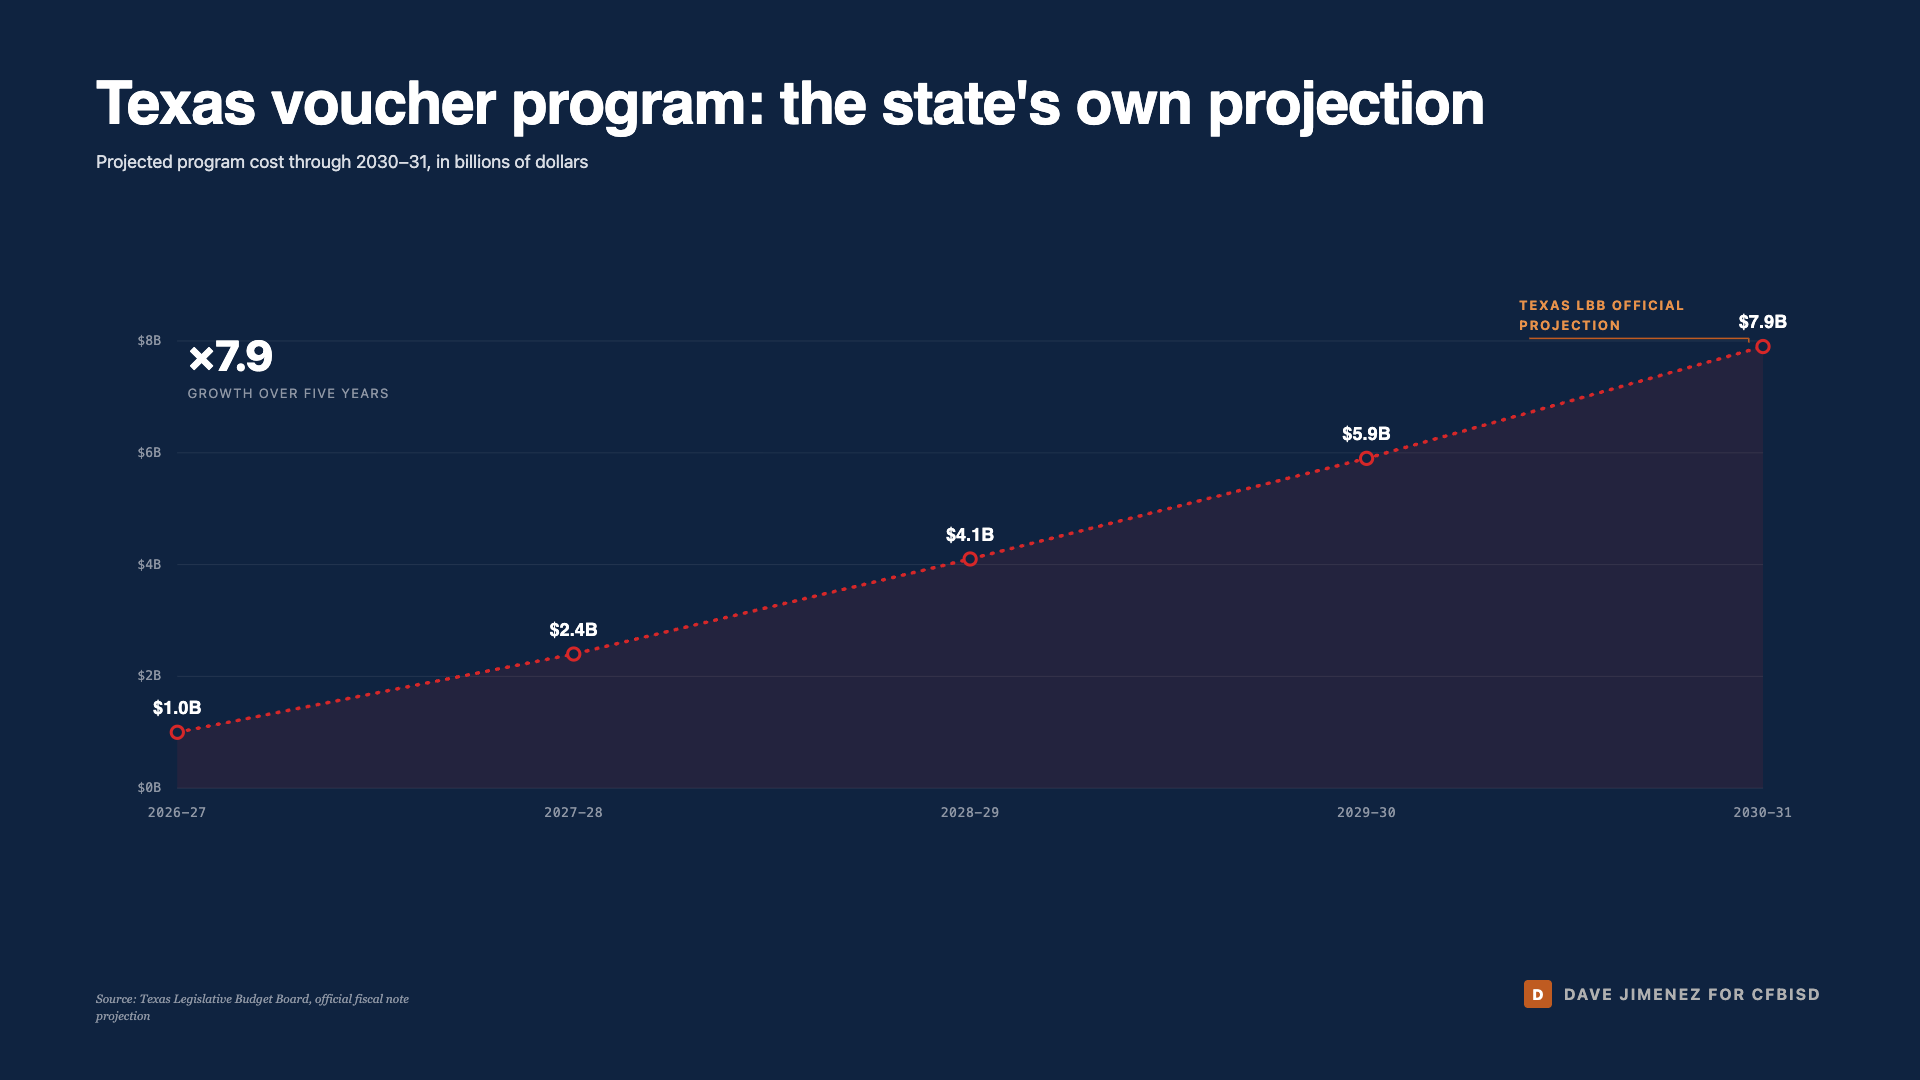
They have chosen instead to pass the largest day-one school voucher program in the nation, a program projected to cost up to $7.9 billion by 2030-31, that will primarily fund tuition for families who already opted out of public education.
What This Has to Do With CFBISD
When CFBISD closed four schools in March 2025, the headlines focused on the local board's decision. When the audited deficit came in at $14.6 million for fiscal year 2024-25, the public conversation focused on district management1. When residents asked why class sizes are growing and teachers are leaving, the conversation focused on local administration.
I want to be clear about something. Local accountability matters. School board governance matters. I ran for the CFBISD Board of Trustees because I believe the local board has work to do that it has not been doing.
But the local board did not freeze the basic allotment for six years. The local board did not refuse to expand Medicaid. The local board did not pass a voucher program that pulls funding out of public schools. The local board did not allow Texas to remain dead last in children's health insurance for 19 consecutive years.
A local board can manage what it has well or badly. It cannot conjure funding out of thin air when the state has decided not to provide it. It cannot insure children whose families have been priced out of every available option. It cannot feed students whose families are struggling because Texas has the highest concentration of food-insecure people in the country.
The structural problem is in Austin. The local consequences are in our classrooms.
What Comes Next: How Texas Can Do Better
Better schools take time. Better outcomes take work. Better communities take courage from all of us.
I wrote earlier this year that the biggest lever for changing any of this is the November 2026 state elections1. That has not changed. The Texas Legislature built the funding system that produced these rankings. The governor's mansion and the legislature write the financial rules, control the Texas Education Agency, and set the per-student allotment. Local school board races matter. State-level races are where the money decisions get made.
If you live in Texas and you care about kids, three actions follow from the data above.
First, know who represents you in Austin. Every Texan can look up their state senator and state representative at fyi.capitol.texas.gov by entering their home address. The people who voted on Senate Bill 2, who froze the basic allotment, who refused to expand Medicaid, are public officials whose votes are public. Their offices take constituent calls.
Second, support the organizations doing the long-term work. Friends of Texas Public Schools tracks data and advocates for public education across the state. Raise Your Hand Texas, founded by Charles Butt of H-E-B, runs candidate forums and policy workshops. The Texas Center for Voucher Transparency provides independent analysis of voucher data the state has chosen not to publish. UnidosUS publishes the only consistent year-over-year analysis of children's health coverage in Texas.
Third, remember in November. The Texas state elections in November 2026 are not abstract. They are the mechanism through which Texas decides whether to continue these rankings or change them. Every voter who shows up makes that decision.
Texas can do better. We have the resources. We have the people. We have the talent. What we have not had is the political will from the state leaders who have held power for the past eleven years.
That can change. It changes when voters decide it should.
Twenty years at the bottom is enough.
Sources
Jimenez, Dave. "What Vouchers Will Cost CFBISD." dave4cfb.com, April 2026.
Jimenez, Dave. "Why CFBISD's Open Enrollment Timing Is Losing Us Students." dave4cfb.com, April 2026.
WalletHub, "States With the Best & Worst School Systems in 2026," July 21, 2025. Texas ranked T-40 in school systems overall.
Federal Reserve Bank of Dallas, "Grading Texas Education Requires a Closer Look Behind the Numbers," August 28, 2025. NAEP rankings for Texas: 38th in fourth-grade reading, 44th in eighth-grade reading, 34th in eighth-grade math.
PolitiFact, "State Sen. Wendy Davis says Texas ranks 44th in education spending per student," January 31, 2011. Citing National Education Association data: Texas ranked 39th in per-pupil spending in 2006-07, spending an average of $9,825 per pupil.
EducationData.org, "U.S. Public Education Spending Statistics [2026]: per Pupil + Total," updated February 17, 2026. Texas ranks 39th in K-12 education funding per pupil.
Texas State Teachers Association, "Even with an extra $8.5 billion for public schools, Texas still trails the national average in per-student funding by $4,000," June 11, 2025.
Ballotpedia, "Fact check: Public school funding in Texas," 2017. Citing NEA Rankings of the States 2016: Texas ranked 36th in per-pupil expenditures at $9,471 per pupil, $2,316 below the 2016 national average of $11,787.
Texans Care for Children, "Texas Has the Worst Uninsured Rate in the US Once Again — and Policymakers Hold the Key to Fix It," September 25, 2025. Citing 2024 Census American Community Survey: 13.6 percent of Texas children and 21.6 percent of Texas adults lacked health insurance in 2024.
The Commonwealth Fund, "2025 Scorecard on State Health System Performance," June 2025. Texas ranked 50th overall.
Spectrum News / WalletHub, "Texas ranks low for children's health care in U.S.," April 10, 2024. WalletHub ranked Texas 51st (last) for percentage of uninsured children and 51st for percentage of children with unaffordable medical bills.
UnidosUS, "Almost 1 Million Texan Children Uninsured: Texas Is America's Worst State at Protecting Children's Health Coverage," December 2024. Texas has ranked as America's worst state for children's health insurance for 19 consecutive years from 2006 to 2024. Updated UnidosUS report (2026) confirms ranking continues.
Feeding Texas, "Hunger in Texas," 2025. Texas food insecurity rate of 17.6 percent, with 5.4 million people facing hunger; child food insecurity rate of 22.2 percent, with 1,673,600 children.
North Texas Food Bank and Tarrant Area Food Bank / Feeding America, "Texas Leads the Nation in Hunger; DFW Ranks Third Among U.S. Metro Areas," May 14, 2025.
Every Texan, "Kids Count," analysis of USDA Economic Research Service data. Texas has had one of the highest rates of child food insecurity in the nation throughout the period 2006-2024.
Texas Legislative Reference Library, "Governor Greg Abbott." Sworn in January 20, 2015. National Governors Association confirms three terms: January 20, 2015 - January 7, 2019; January 8, 2019 - January 17, 2023; January 17, 2023 - present.
FOX 7 Austin, "Inauguration Day in Texas: Gov. Greg Abbott sworn in for third term," January 18, 2023. Patrick was first elected lieutenant governor in 2015 and has served three terms.
Texas Education Agency, basic allotment data. Allotment was $6,160 from 2019 through 2024, increased to $6,215 in 2025 under House Bill 2 of the 89th Texas Legislature.
Texas Comptroller of Public Accounts, Economic Stabilization Fund (Rainy Day Fund) projections.
Raise Your Hand Texas. Texas Legislative Budget Board, fiscal note projection for Senate Bill 2 (89th Texas Legislature). Voucher program cost projected up to $7.9 billion by 2030-31.
Texas Center for Voucher Transparency, an Our Schools Our Democracy initiative providing independent analysis of Texas Comptroller voucher data.
Dave Jimenez writes about public education accountability, school funding, and the structural choices that shape outcomes for children in Texas. He lives in the Carrollton-Farmers Branch Independent School District with his wife Dr. Stephanie Jimenez, who served the district for 30 years as a teacher, administrator, and principal. Dr. Jimenez is currently the Assistant Superintendent in Bonham ISD. The conversation will continue here at dave4cfb.com.
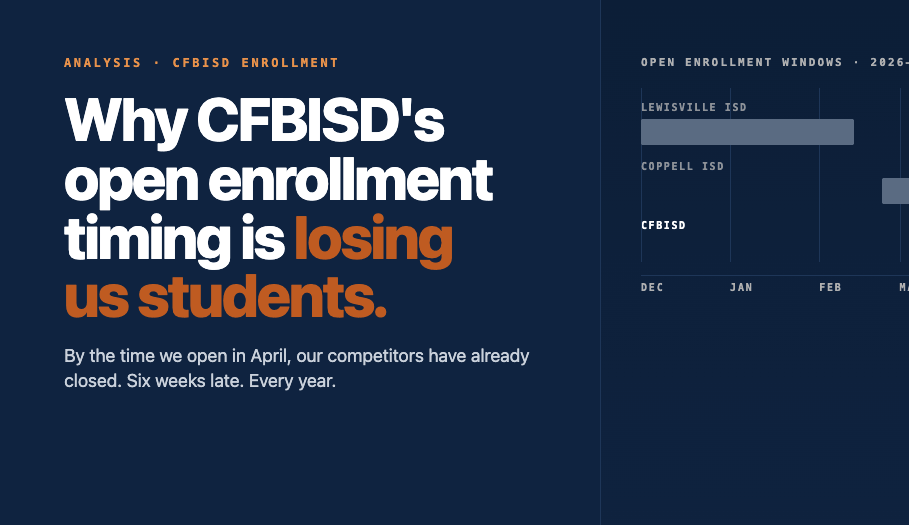
Why CFBISD's Open Enrollment Timing Is Losing Us Students
CFBISD opens transfer enrollment April 1. Lewisville closed February 13. Coppell closed March 6. By the time we open our doors, the families we're trying to attract have already enrolled somewhere else.
A Self-Inflicted Disadvantage Hiding In Plain Sight
CFBISD has a declining enrollment problem and an enrollment recruitment process that doesn't reflect the urgency of solving it. The district opens its 2026-27 transfer enrollment window on April 1. By that date, the families most likely to consider transferring into CFBISD have already enrolled their kids somewhere else.
This isn't a marketing problem. It's a calendar problem.
Is anyone asking why? I am.
The Competitive Landscape
Open enrollment, also called inter-district transfer, is the process by which families who don't live within a district's boundaries can apply to send their children to that district's schools. In the Dallas-Fort Worth Metroplex, where families have real choices, the timing of when each district opens its transfer window determines who gets first pick of the available students.
Here are the open enrollment windows for the 2026-2027 school year for CFBISD and our two closest competitor districts:
Lewisville ISD: December 1, 2025 through February 13, 2026.
Coppell ISD: February 23, 2026 through March 6, 2026 for new students.
CFBISD: April 1, 2026 through May 8, 2026.
Lewisville closed its transfer window on February 13. Coppell closed theirs on March 6. By the time CFBISD opened its doors on April 1, families who had been shopping for a new district since the fall had already committed elsewhere. We weren't competing for those families. We weren't even at the table.
What this Costs Us
Texas school district funding is driven primarily by enrollment. Every student who chooses CFBISD brings approximately $11,487 in per-student funding to the district, per the Texas Tribune Schools Explorer. Every student who chooses a different district takes that funding with them.
CFBISD enrolled 24,165 students per the 2024-25 Annual Comprehensive Financial Report, down from a peak of 25,796 in 2016. That's a loss of more than 1,600 students over a nine-year period. At $11,487 per student, that represents over $18 million in annual funding the district no longer receives. Approximately 22,700 students started in a CFBISD School at the beginning of the 2025-2026 school year, a drop of approximately 1,465 and impact of nearly $17 million.
A portion of that decline is driven by birth rate trends and demographic shifts that no district can control. But a meaningful portion is driven by competition for transfer students with our neighboring districts. And in that competition, we're showing up six weeks late.
The math is straightforward. If our open enrollment window opened in early February instead of April 1, we'd be in the conversation when families are actively shopping. We'd have access to the same pool of transfer-seeking families that Lewisville and Coppell are pulling from. Right now, those families are already enrolled elsewhere by the time we send out our welcome message.
This doesn’t even take into consideration the families considering moves to charters, homeschooling, and the private school subsidy vouchers/ESAs.
We are in a highly competitive situation and we’re sitting on the sidelines.
What this Signals about Governance
This isn't a complicated problem. It's not a budget issue. It's not a state mandate. It's not a recapture issue. It's a calendar decision that the district controls entirely.
Why hasn't anyone asked about it?
Possibility one: The administration has a reason for the April 1 timing that hasn't been explained publicly. Maybe it has to do with staffing decisions, finalizing campus capacity, or aligning with other administrative deadlines. If so, the board should know what that reason is and whether it justifies giving up the first-mover advantage to every competitor district in the area.
Possibility two: This is just how it's always been done. Nobody has questioned it, so nobody has changed it. That's the most common explanation for institutional inertia, and it's the explanation a board exists to interrupt.
Either way, the board's job is to ask. To require the administration to justify the timing. To compare CFBISD's calendar against peer districts and ask why we're consistently behind. To direct the administration to evaluate whether opening enrollment earlier would result in measurable enrollment gains.
I haven't seen evidence that this question is being asked.
The Pattern Matters
The enrollment window timing is one example of a broader pattern. The district has a marketing problem and a math problem stacked on top of each other, and the math problem doesn't get solved by better marketing.
CFBISD has a story to tell. We have a B accountability rating from TEA. We have an Early College High School with an A rating. We have strong CTE programs, strong elementary reading scores, and a community of educators and families who care deeply about this district. The story is real.
But the story doesn't matter if the families it's meant to reach have already enrolled their kids somewhere else by the time we tell it.
A board focused on enrollment recovery should be asking questions like:
When does our window open relative to competitors?
How many families inquired about transfers this year and how many actually enrolled?
What's our conversion rate from inquiry to enrollment?
Where in the process are we losing families and why?
These are not academic questions. They're the questions every business asks when its customer acquisition is weakening. A school district isn't a business, but enrollment is a market, and CFBISD is in a market with real competitors who are running their playbook better than we are. That isn’t an opinion. It’s a fact backed by the declining enrollment and more importantly the declining enrollment percentages when compared to our neighboring public school districts, AKA our competitors.
What I'd Do as a Trustee
I'd ask the administration to walk the board through the historical rationale for the current open enrollment timing. If there's a defensible operational reason, I want to understand it.
I'd ask for a comparative analysis of how peer districts schedule their enrollment windows and what their conversion outcomes look like.
I'd ask for the conversion data from CFBISD's own enrollment process: how many inquiries, how many applications, how many actual enrollments, and where families are dropping off in our process.
I'd direct the administration to evaluate whether moving the open enrollment window earlier would result in measurable gains, with a clear timeline for that evaluation. I’d argue that the increased number of available families considering where they’ll go to school makes this move a no-brainer.
And I'd hold leadership accountable for moving from analysis to action. CFBISD doesn't need another study group. It needs a board willing to ask why we keep doing the same things and getting the same results.
The Bottom Line
We are spending real money trying to attract students to CFBISD while running a calendar that systematically excludes us from the families most likely to consider transferring. The cost of fixing it is approximately zero. The cost of not fixing it is roughly $11,487 for every family that picked Lewisville or Coppell because we weren't open for business when they were ready to choose.
Enrollment recovery is one of the most important challenges this district faces. The voucher program is going to make it harder. We don't have time to keep handing our competitors a six-week head start.
This is the kind of question I want to be asking from a board seat. Not because it's flashy, but because it's the kind of question nobody else is asking, and the cost of not asking it is being paid every year in students we never had the chance to recruit.
Sources
CFBISD enrollment dates: CFBISD official enrollment page (cfbisd.edu)
Coppell ISD enrollment dates: Coppell ISD official enrollment page
Lewisville ISD enrollment dates: Lewisville ISD official transfer page
Per-student funding figure ($11,487): Texas Tribune Schools Explorer, CFBISD funding profile
CFBISD enrollment figures (24,165 current; 25,796 peak in 2016): CFBISD 2024-2025 Annual Comprehensive Financial Report (ACFR), audited by Whitley Penn LLP
TEA accountability ratings: Texas Education Agency 2025 District and Campus Accountability Ratings
Dave Jimenez is a candidate for the CFBISD Board of Trustees. Election Day is Saturday, May 2, 2026. Polls are open from 7 AM to 7 PM. CFBISD uses cumulative voting; you have two votes and you can give both to one candidate. You should vote for Dave… twice. You’re allowed
What Vouchers Will Cost CFBISD
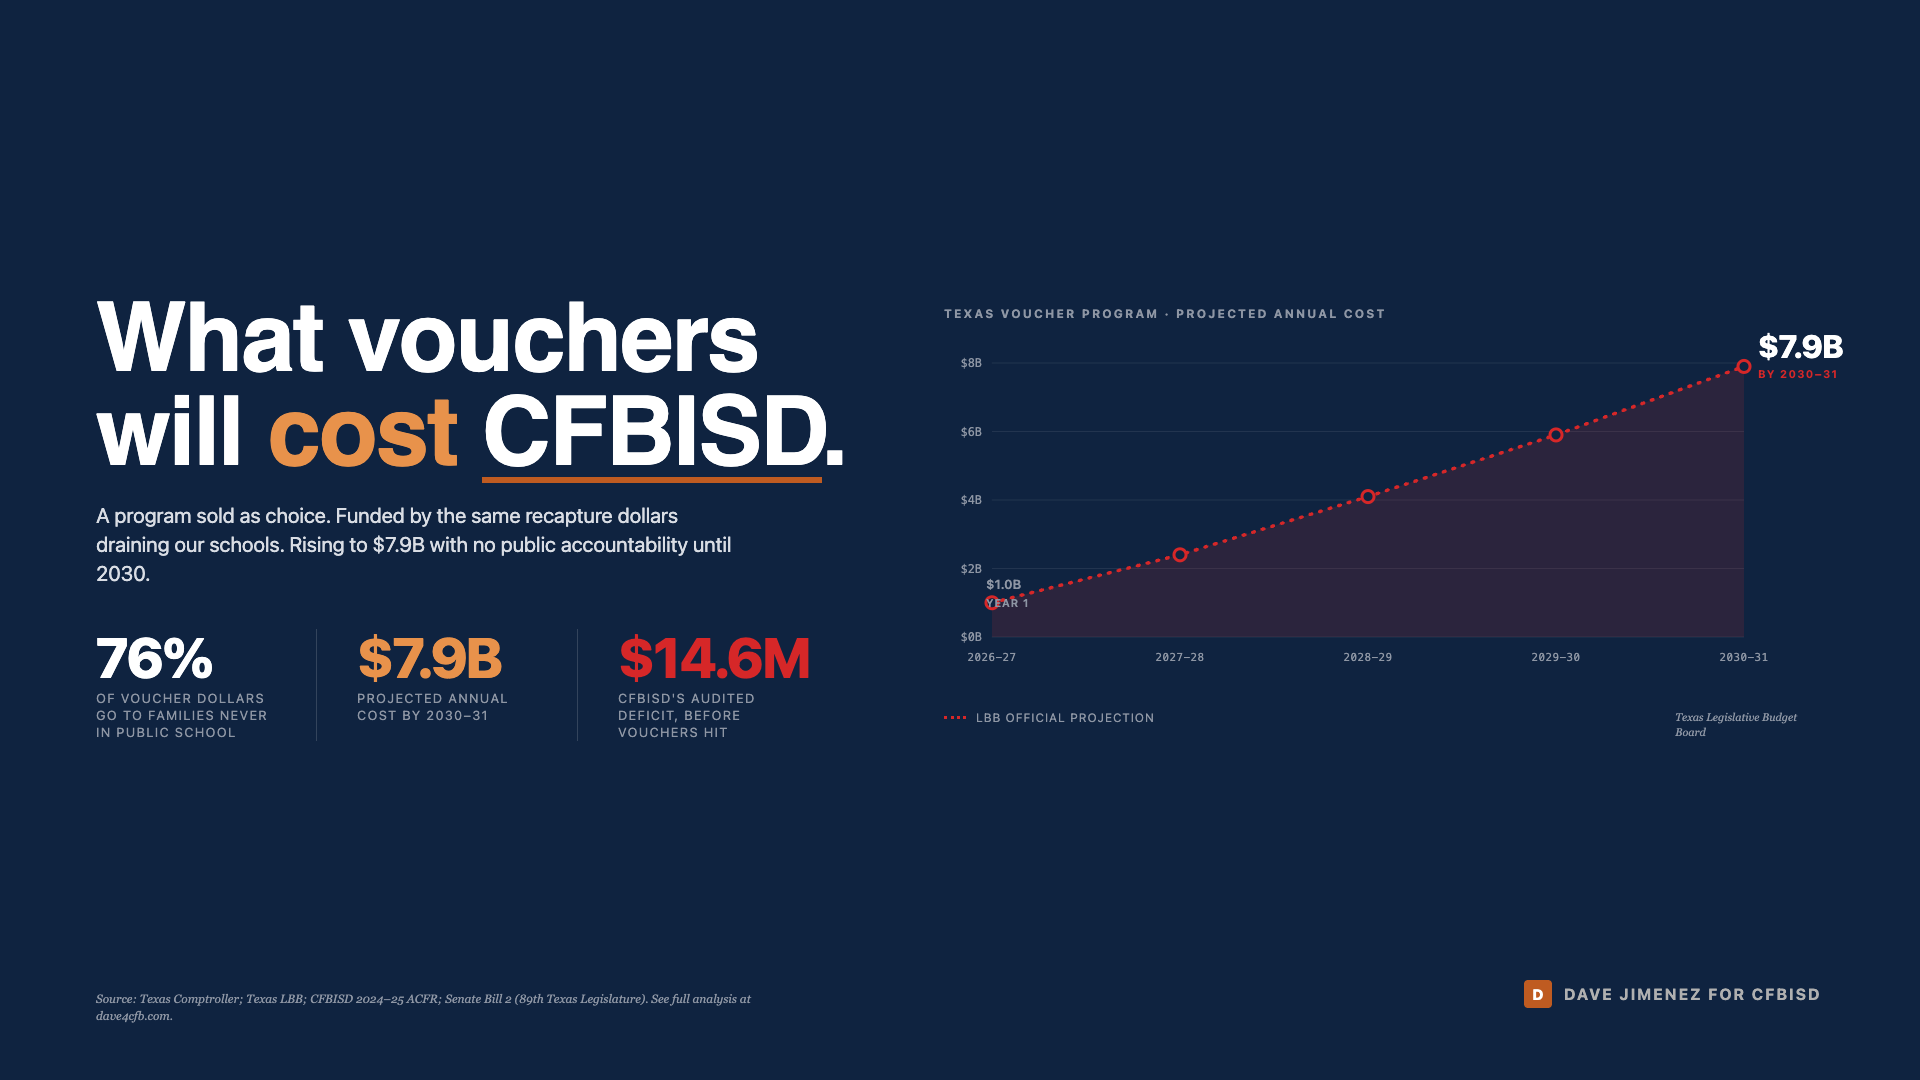
The voucher data is in. 274,000 Texas families applied in the first window, but 76% are not in public schools. Less than 1% of public school families applied. The Texas Legislative Budget Board projects costs could hit $7.9 billion by 2030. Florida passed the same law three years ago. Here's what their experience tells us about CFBISD's future.
A district-specific analysis of Texas Senate Bill 2 and the Florida precedent
THE SHORT VERSION
Texas passed the largest day-one school choice program in the country at the end of the 2025 Legislative Session. The first round of voucher application data is in. Florida, which passed a nearly identical law in 2023, has three years of real-world results we can study. I did that and here is what it all means for CFBISD, and other districts throughout our state.
We closed four schools in March 2025 before a single voucher dollar left the state. When the board made that decision, the district was projecting a $19 million shortfall. The audited result for fiscal year 2024-25 came in at a $14.6 million General Fund deficit per CFBISD's own Annual Comprehensive Financial Report. That's the real number. The school consolidation (Central, Furneaux, McCoy Elementary Schools and Long Middle School) reduced 2,300 empty seats out of approximately 9,800 the district had identified across its campuses. The Texas Legislature froze the basic allotment from 2019 through 2024 and raised it by $55 in 2025, the first increase in six years while inflation ate into every dollar.
CFBISD is a recapture district. We sent $7.8 million back to the state under Chapter 49, per the Texas Tribune Schools Explorer. When students leave, local tax revenue doesn't drop. Our fixed property tax base still generates the same dollars. But our formula entitlement shrinks, and the difference gets swept into a larger recapture payment to Austin. We absorb the full loss.
The state is subsidizing families who never used public schools. 274,183 Texas families applied for TEFA vouchers in the first window. According to analysis by the Texas Center for Voucher Transparency, 76% of voucher applicants are not currently enrolled in public schools. That means that 76% of the $1 Billion allocated by the legislature is a subsidy, pure and simple. The opposite of how this was sold. Fewer than 1% of Texas public school families applied for the program. The voucher program isn't a response to public school families fleeing the system. It's primarily paying families who never chose public schools in the first place.
The financial trajectory is steep. The Texas Legislative Budget Board projects voucher costs could reach $7.9 billion by 2030-31. That money comes from the same general revenue pool CFBISD's recapture payments flow into.
Florida's experience tells us what comes next. Florida passed HB 1 in 2023 making vouchers universal. Florida's State Education Estimating Conference projects public school enrollment will decline by 66,000 students over five years, while voucher participation grows by 240,000. According to Step Up for Students (Florida's voucher administrator), about 69% of students new to the voucher program were already enrolled in private schools. Voucher spending in Florida grew from $1.4 billion in 2022-23 to $3.9 billion in 2024-25.
The accountability gap is permanent. Public schools take STAAR, get A-F ratings, face state intervention for failure. Private schools taking TEFA voucher money report to the Comptroller, not TEA, take a private test, and don't publish school-level results. The voucher law only requires reporting to the legislature after five years of the program, leaving taxpayers with limited oversight during the early stage of the nation's largest voucher program.
WHAT THE EARLY TEXAS DATA TELLS US
The early data from the Texas Center for Voucher Transparency, drawing from Texas Comptroller of Public Accounts records, makes one thing clear: this program is not what it was sold as.
It is not a lifeline for public school students seeking better options. Of 274,183 total applications, only about 24% came from families with students currently enrolled in Texas public or charter schools. Of the roughly 5.5 million students in Texas public schools statewide, fewer than 1% of families applied for vouchers. The narrative that vouchers are responding to mass dissatisfaction with public education is not supported by the application data.
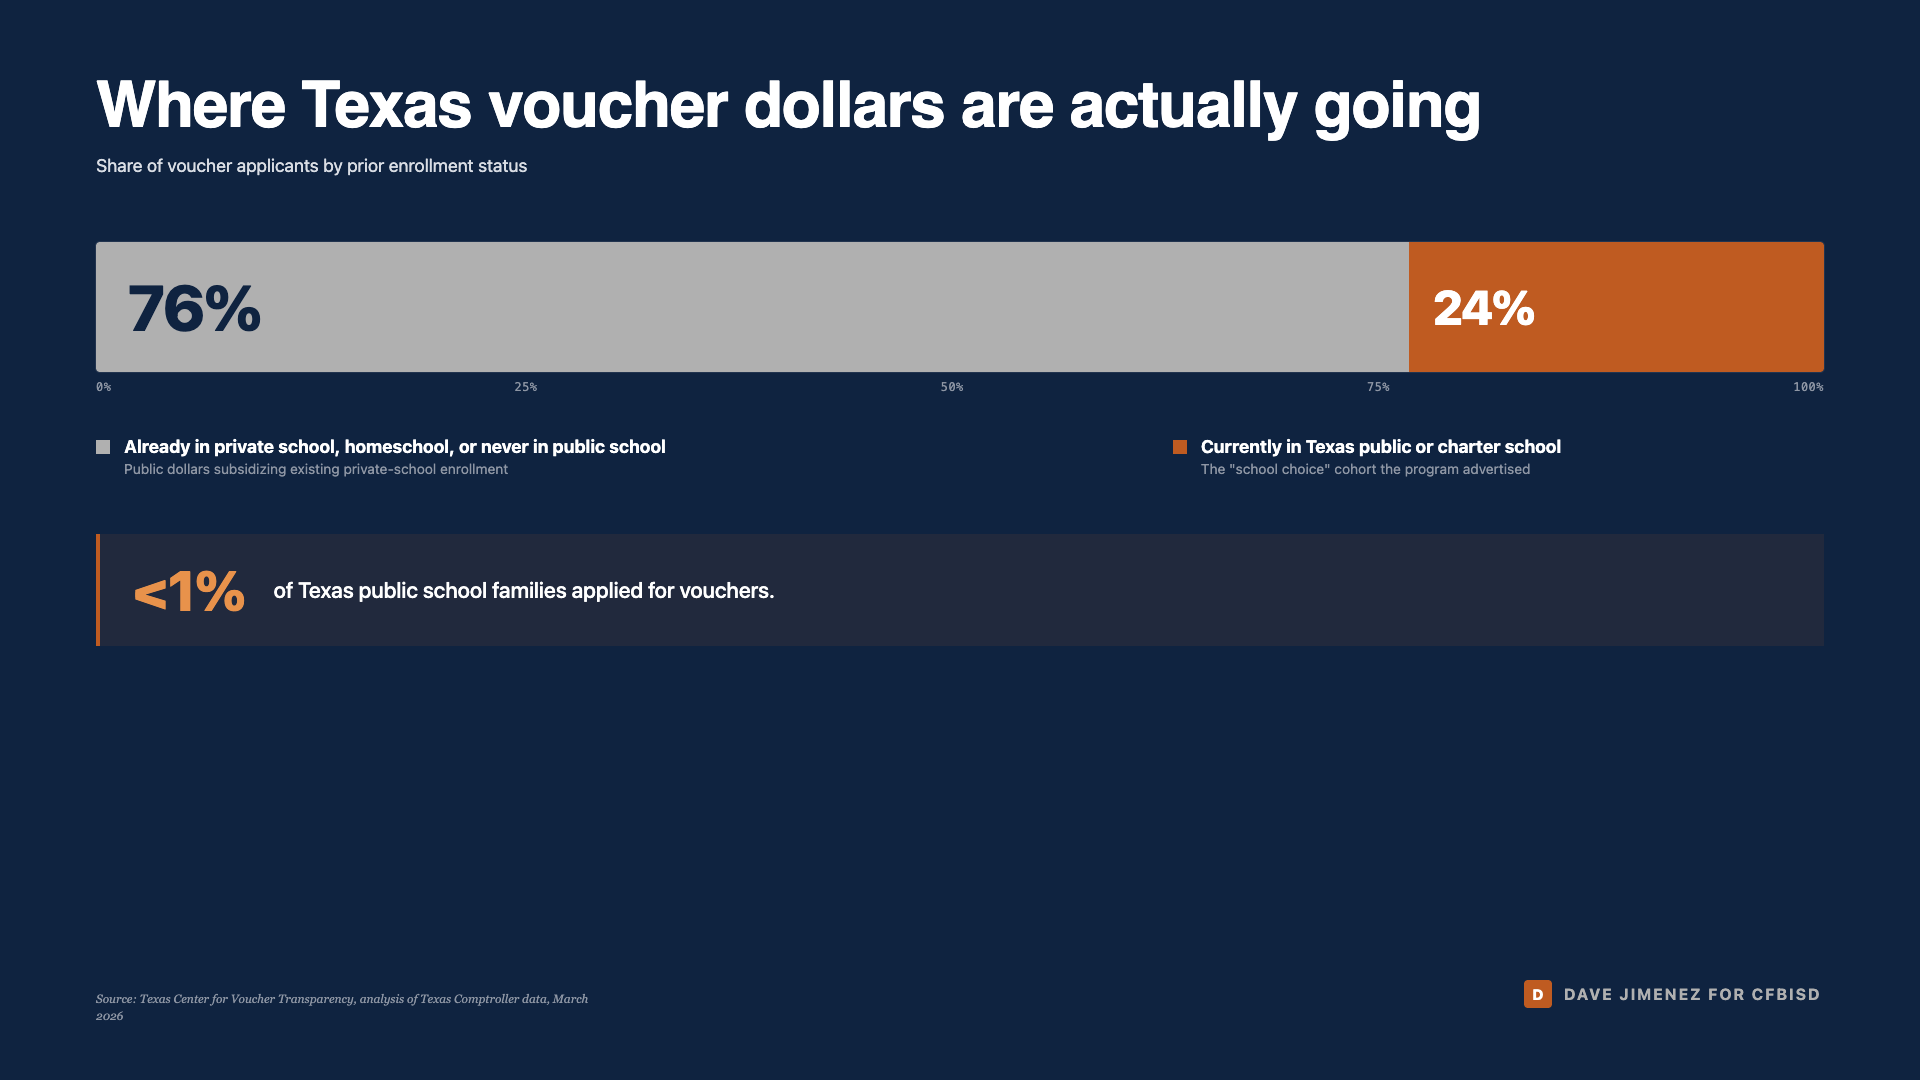
It is largely a tuition subsidy for families who never used public schools. 76% of applicants come from families whose children already attend private schools, are homeschooled, or never attended public school. The Texas program is functioning the same way Florida's program functioned: most participants were not in public school to begin with.
Geographic access is highly uneven. More than 60% of Texas's 254 counties currently have no schools accepting vouchers. Approximately 70% of participating private schools are concentrated in the Dallas-Fort Worth, Houston, San Antonio, and Austin urban areas. According to Texas Observer reporting, more than 180 of Texas's 254 counties have no participating elementary, junior, or senior high schools. Rural Texans are paying taxes that fund a program their families largely cannot access.
The "school choice" framing obscures who actually has the choice. Private schools are not required to accept any student who shows up with a voucher. They can reject applicants based on academic record, behavior, faith, or special education needs. According to Texas Observer analysis of the 291 participating schools that offer education beyond kindergarten:
More than 90% are affiliated with or owned by a religious or faith-based group
More than 100 require or prioritize students of the same faith
60 have written policies that discriminate against LGBTQ+ students
The students the program claims to prioritize are often unable to access it. Approximately one-third of participating private schools charge tuition exceeding the $10,474 voucher amount, putting access out of reach for lower-income families who would have to front the difference. Fewer than a dozen participating schools indicated they offer special education services, despite the program's stated priority for students with disabilities. Students with disabilities can receive up to $30,000 in voucher funds, but private schools accepting that money are not required to actually provide the special education services those students need under federal law.
The financial scope is staggering. The Legislative Budget Board projects voucher costs could reach $7.9 billion by 2030-31. The program is the largest day-one school choice initiative in the nation. The voucher law requires reporting to the legislature only after five years of operation, meaning Texas taxpayers will fund this program at multi-billion-dollar scale for half a decade before the legislature receives a formal accounting.
FLORIDA IS NOT A WARNING.
IT'S A PREVIEW.
Florida passed HB 1 in March 2023. It removed income limits on their existing voucher program, making it universal, just like Texas's TEFA. Three years in, the data tells us exactly what to expect.
The state-level numbers tell the story
Florida's State Education Estimating Conference (April 11, 2025) projects public school enrollment will decline by 66,000 students over five years. Voucher participation is projected to grow by 240,000 students over the same period. The Florida Department of Education reports that 1.4 million Florida students now attend a school of choice, with more than 500,000 attending a private school on a voucher and 155,000 reportedly homeschooled.
District-level enrollment loss is hitting Florida's largest districts hard
Per FLDOE Student Enrollment data (as compiled in OpenData's analysis at labs.tryopendata.ai), between 2018-19 and 2025-26, Florida's six largest districts experienced significant enrollment declines: Broward lost approximately 35,000 students, Miami-Dade lost approximately 29,000, Palm Beach lost approximately 9,000, Orange lost approximately 8,000, Hillsborough lost approximately 7,000, and Duval lost approximately 3,000. Orange County alone lost 7,000 students this fall, attributed to a combination of vouchers, declining birth rates, and immigration enforcement concerns.
The financial impact on Florida public schools is documented
Florida voucher spending grew from $1.4 billion in 2022-23 to $3.9 billion in 2024-25 (per Florida Policy Institute analysis), with $2.8 billion through Family Empowerment Scholarships and $1.1 billion through Florida Tax Credit Scholarships. Projected 2025-26 spending is approximately $5 billion. Vouchers now constitute 24.2 percent of total Florida Education Finance Program spending. Florida ranks 50th nationally in average teacher pay at $54,875.
The accountability data is harder to find by design
Florida investigations have documented voucher funds being misused for things like Disney vacations. Arizona has documented voucher funds spent on LEGOs. The Texas Comptroller's office denied requests during the rulemaking process for participating private schools to disclose information including school-level performance data, available spots by grade level, graduation rates, and money recouped for ineligible expenses. Iowa, for comparison, requires voucher students to take the same state assessment as public school students. Texas chose not to require this.
WHAT THIS MEANS FOR CFBISD
Let me put some directional numbers on this. These are estimates based on Florida's actual statewide impact scaled to CFBISD's size. They're directional, not precise, and the actual numbers will depend on how many Texas families take up vouchers.
Current CFBISD enrollment: 24,165 students per the 2024-2025 ACFR, down from a recent peak of 25,796 in 2016.
Florida's projected statewide enrollment decline through 2030: Approximately 2.5% (66,000 of nearly 3 million students).
If CFBISD experiences a similar decline beyond current projections: Approximately 600 additional students lost by 2030 attributable to voucher uptake.
Revenue impact estimate: Public school per-student funding in Texas runs approximately $11,487 per CFBISD's reported per-student funding from the Texas Tribune Schools Explorer. The formula entitlement loss per departing student depends on the specific funding mix. Even using conservative assumptions, voucher-driven enrollment loss could compound CFBISD's existing deficit by several million dollars annually by 2030.
Stacked on our current $14.6M audited deficit: Without offsetting revenue increases or further cost reductions, voucher-driven losses could push CFBISD toward a structural deficit in the high teens or low twenties of millions annually.
The kindergarten cliff is the scariest part of the Florida data. Younger cohorts that never enter public school don't show up in current-year enrollment loss numbers. They show up over the next 13 years, every year, as smaller and smaller classes roll forward. CFBISD's own demographer report (December 2024) already showed three consecutive years of declining attendance in kindergarten, first, fourth, and ninth grade.
And this is on top of enrollment decline already happening. CFBISD's demographer report projects continued enrollment decline based on birth rates, housing costs, and charter school competition alone. Vouchers accelerate a trend that was already underway.
THE RECAPTURE LOOP
This is the part that voters hear least about. CFBISD is a Chapter 49 recapture district. That means we're classified as "property wealthy" because our taxable property value per student is above the state threshold. Per the Texas Tribune Schools Explorer, in the most recent reported year we collected $243.8M in local property taxes and sent $7.8M back to Austin for redistribution to property-poor districts.
Here's what happens when our enrollment drops:
Local property tax collection stays roughly the same. Property values don't fall when kids leave.
Our formula entitlement shrinks because entitlement is based on enrollment.
The gap between what we collect and what we're entitled to keep grows.
That gap flows to the state as increased recapture.
Recaptured dollars enter the Foundation School Fund and general revenue.
General revenue is the same pool that funds TEFA vouchers.
So the chain looks like this: enrollment drops → entitlement drops → recapture goes up → recaptured dollars feed the voucher program → voucher program funds the private schools pulling kids out of public schools → enrollment drops again.
CFBISD taxpayers are unknowingly helping fund the system that's dismantling their own district. Every time we send a dollar to the state, we don't know if it ends up funding a classroom in a property-poor district, a state budget surplus, or a voucher for a family that never used public schools.
THE ACCOUNTABILITY GAP IS BUILT INTO THE DESIGN
Let me be clear about what Texas created with TEFA.
Public schools:
Take STAAR, EOC, and other state-mandated assessments
Receive A-F letter grade ratings from TEA
Publish school-level performance data annually
Face state intervention, takeover, or closure for chronic underperformance
Subject to TPIA (Texas Public Information Act) requests
Board members are elected and subject to open meetings laws
Financial reporting is public and auditable
Required to accept all students, including those with disabilities, English learners, and those with disciplinary records
Required to provide special education services under federal law
TEFA voucher-funded private schools:
Take a "nationally norm-referenced assessment" of the school's choice
Report to the Comptroller, not TEA
Not required to publish school-level results
No letter grade ratings
No state intervention or takeover authority
Not subject to TPIA
Not subject to open meetings laws
Not subject to the same financial reporting requirements
Permitted to set admission requirements and deny students for any reason including faith, academic record, behavior, or disability
Not required to follow federal special education laws even when receiving up to $30,000 per disabled student
No required reporting to the legislature for the first five years of the program
Iowa, for comparison, requires voucher students to take the same state assessment as public school students. It's possible. Texas chose not to require it.
The consequence is asymmetric accountability. Public schools are graded on outcomes, punished for failure, and defunded for underperformance. Private schools receiving the same public dollars face none of that. The system being defunded is the only one the public can see. The system being funded is invisible to the public.
This should offend conservatives as much as it offends public school advocates. Conservatives built their case for school choice on the premise that competition produces better outcomes. If competition is going to produce better outcomes, someone has to be able to measure who's doing better. Texas chose not to create that scoreboard. The claim that vouchers will improve outcomes is being made without a way to verify it.
ONE NOTE ON CFBISD'S OWN FISCAL DISCIPLINE
It's important to be honest about this: CFBISD is not a financially mismanaged district at the operational level. The district has earned an "A" or Superior Achievement rating in TEA's School FIRST Financial Integrity Rating System every year since 2002-03, including for 2024-25. The General Fund decrease of $14.6 million in 2024-25 is real, but the district maintains an unassigned General Fund balance of $89.8 million (29.2% of expenditures), which is a healthy reserve.
The argument here is not that the district is wasting money. The argument is that the state funding structure, the recapture system, and now vouchers are creating a systemic problem that no amount of operational discipline can fix. A board that demands transparency, asks hard questions, and refuses to rubber-stamp administration recommendations is part of the solution. So is a state legislature that funds public education at levels matching inflation. The district has done much of what it can. Austin has not.
WHAT CAN WE ACTUALLY DO
The biggest lever is the November 2026 state elections. The Texas Legislature built this funding system. The Governor's mansion and the legislature write the rules, control TEA, and set the per-student allotment. Local school board races matter, but the money decisions get made in Austin.
Stop marching on CFBISD. Start marching at the Capitol. The CFBISD board didn't cause a $14.6M audited deficit. State funding formulas, a frozen basic allotment, and the structure of the voucher program did. Protesting school closures at district HQ is yelling at the people on the receiving end of the math.
Demand the state raise the basic allotment. The basic allotment was frozen at $6,160 from 2019 through 2024, with a $55 increase taking it to $6,215 in 2025. That's the first increase in six years. Inflation has eaten roughly 20% of the allotment's purchasing power. If the state had increased the allotment to keep pace with inflation, districts like CFBISD wouldn't be closing schools. The state chose to sit on a multi-billion-dollar surplus instead, and is now using it to fund vouchers.
Demand equal data transparency. If billions in taxpayer dollars are flowing to private schools through TEFA, those schools should publish their test results at the school level. The same transparency standard that applies to CFBISD should apply to every school receiving public money. This should be an easy argument to make to a conservative legislature that says it believes in accountability.
Support independent transparency efforts. Our Schools Our Democracy launched the Texas Center for Voucher Transparency (TCVT) and a Voucher Watchdog Reporting Portal that allows Texans to confidentially report potential misuse of voucher funds. When the state declines to provide oversight, civil society has to step in.
Know who represents us in Austin. CFBISD is split across multiple Texas legislative districts. Voters should look up their specific representatives at fyi.capitol.texas.gov by entering their home address. These are the people who voted on SB 2 and control future education funding decisions. Their votes are public. Their offices take constituent calls.
Organized advocacy matters. Raise Your Hand Texas (founded by Charles Butt of H-E-B) has been running workshops and candidate forums across the state. Friends of Texas Public Schools (FOTPS) tracks data and advocates for public education. They have the infrastructure to help parents and community members advocate at the state level effectively.
Local elections still count. A well-governed local board can't replace lost state funding. But it can manage what remains with discipline, demand transparency, push back on bad decisions, and make sure every dollar spent in CFBISD is spent on students. That's the work I'm running to do.
SOURCES
CFBISD financial data:
CFBISD 2024-2025 Annual Comprehensive Financial Report (ACFR), audited by Whitley Penn LLP. Available at cfbisd.edu/departments/business-support-services
2024-2025 General Fund decrease (operating deficit): $14,629,522
Total General Fund expenditures: $307,028,019
Unassigned General Fund balance: $89,767,332 (29.2% of expenditures)
Student enrollment (PEIMS snapshot): 24,165
Enrollment history: 25,796 (2016) → 25,611 (2020) → 24,165 (2025)
School FIRST Superior Achievement rating since 2002-03, including 2024-25
Texas Tribune Schools Explorer, CFBISD funding profile (schools.texastribune.org/districts/carrollton-farmers-branch-isd/funding/)
CFBISD news release on Trustee approval of school consolidation, March 6, 2025: 2,300 empty seats reduced through consolidation
CFBISD "Planning for Future Success" page documenting 9,800 empty seats from October 2024 demographer report
Star Local Media, "Demographer reports CFBISD enrollment decline due to charter schools, housing trends," December 17, 2024
Texas TEFA / SB 2 sources:
Texas Education Freedom Accounts official program site: educationfreedom.texas.gov
Texas Comptroller's Office Preliminary Student Application Fact Sheet: 274,183 total applications
Friends of Texas Public Schools, "What Early Voucher Data is Telling Us" (April 2026): 76% of voucher applicants not currently enrolled in public schools; fewer than 1% of public school families applied
Texas Center for Voucher Transparency (Our Schools Our Democracy): independent analysis of Texas Comptroller data
Texas AFT, "TCVT Report: Voucher application data raises new questions about who the program really serves" (March 2026)
Texas Observer investigation of 291 participating private schools: 90%+ religious affiliation, 100+ schools require or prioritize same-faith students, 60 schools have written policies discriminating against LGBTQ+ students, ~33% have tuition exceeding voucher amount, 70% concentrated in DFW/Houston/San Antonio/Austin urban areas, 180+ of 254 Texas counties have no participating elementary/junior/senior high schools
Texas Legislative Budget Board (LBB): voucher program cost projection up to $7.9 billion by 2030-31
Texas AFT and ProPublica/Texas Tribune: 60+ instances of nepotism, self-dealing, and conflicts of interest among 27 private schools that would have violated state laws if those schools were public
KXAN Austin, "Capitol Context: Here's who applied for Texas school vouchers" (April 2026)
Fox 7 Austin, "Texas school voucher applications surge past 274,000 as initial deadline closes" (April 2026)
San Antonio Report, "New data reveals who applied for Texas' school voucher program" (April 2026)
Texas Education Agency basic allotment data: $6,160 (2019-2024) → $6,215 (2025)
Florida voucher impact sources:
Florida State Education Estimating Conference report, April 11, 2025: 66,000 student decline projection over five years; 240,000 voucher participant growth projection
Florida Policy Institute, "Florida Continues to Drain Much-Needed Funds Away from Public Schools" (January 2025)
Florida Policy Institute, "FY 2025-26 Budget Summary: Education" (August 2025): voucher spending growth $1.4B (2022-23) → $3.9B (2024-25), projected $5B (2025-26)
Step Up for Students (Florida voucher administrator): approximately 69% of students new to vouchers were already in private schools
Central Florida Public Radio (WUSF/CFP) coverage, October 2025: Orange County lost 7,000 students this fall
Network for Public Education, "Sue Kingery Woltanski: Florida's Voucher Expansion is Gutting Public Education" (May 2025)
District-level enrollment loss figures (Broward -35k, Miami-Dade -29k, Palm Beach -9k, Orange -8k, Hillsborough -7k, Duval -3k between 2018-19 and 2025-26): sourced to OpenData analysis of FLDOE Student Enrollment data
Methodology notes:
Voucher-driven enrollment projections for CFBISD are scaled from Florida's projected 2.5% statewide decline applied to CFBISD's current enrollment of 24,165
Per-student revenue impact uses CFBISD's reported per-student funding of $11,487 from Texas Tribune Schools Explorer as a reference
These projections are directional estimates, not precise forecasts. Actual outcomes depend on Texas voucher uptake rates, which will not be known until the program has operated for several cycles.
District-level Florida enrollment figures are sourced from OpenData analysis at labs.tryopendata.ai, which compiled FLDOE Student Enrollment data.
Prepared in April 2026 as part of Dave Jimenez's candidacy for CFBISD Board of Trustees. Feedback, corrections, and additional data welcome. dave4cfb.com.